
Usage Stats
Overview
To help librarians evaluate the value of their Dewey subscription and understand engagement across campus, we offer detailed Usage Stats. These metrics summarize activity by dataset, time, and user behavior—making it easier to communicate usage, justify renewal, and understand which data products are driving the most value.
What’s Included?
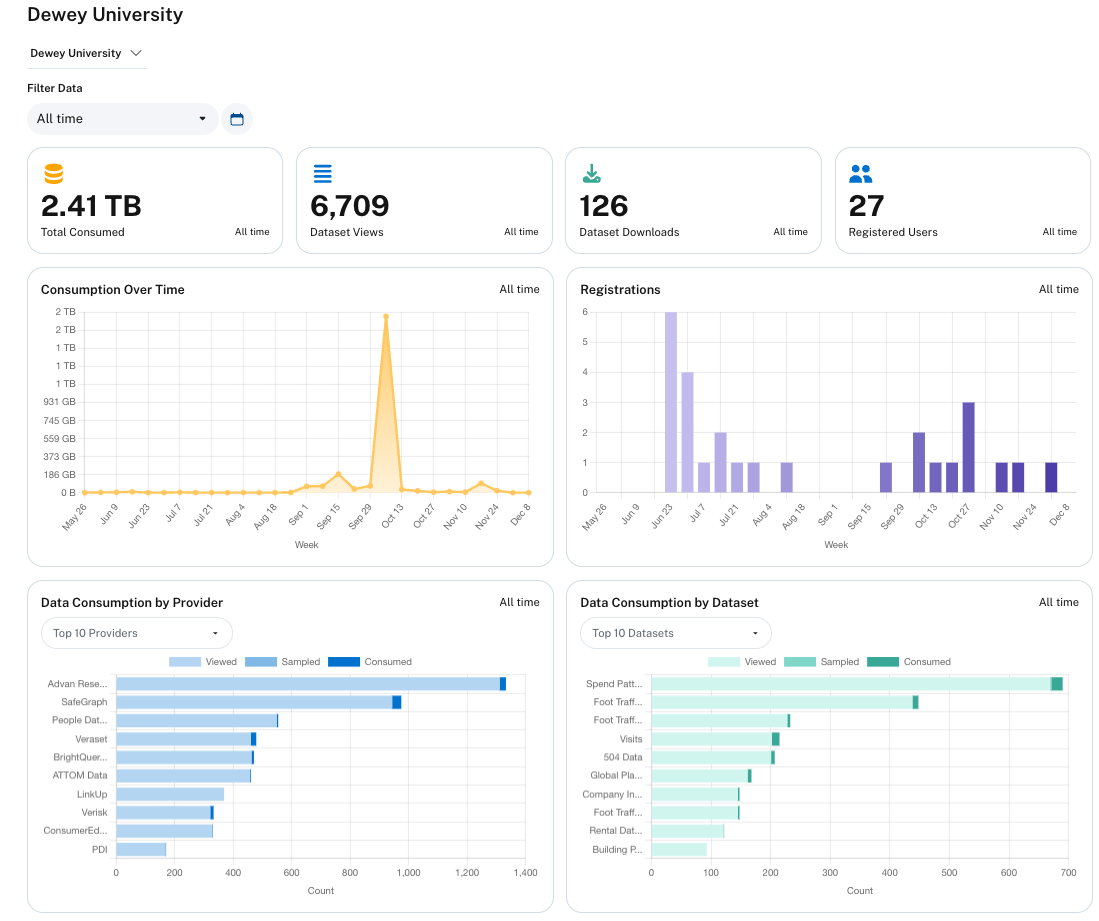
The usage stats dashboard provides an institution-wide view of how users are interacting with data across Dewey. The key metrics include:
- Total Consumed: The total amount of data downloaded in GB
- Dataset Views: How many times datasets were viewed
- Dataset Downloads: Number of unique dataset downloads
- Registered Users: Number of users that have signed up within your university's account
Global filters can be applied to adjust the time range for all metrics.
- Usage stats (consumptions, views, and downloads) start when Dewey launched it's new platform in May of 2025. Registered users goes back to 2022.
- Data consumed prior to November 31 is calculated as the amount of Data requested.
Engagement Over Time
Each report includes a timeline chart that shows:
- Consumption Over Time
- Registrations by month
This helps identify surges in interest (e.g. around thesis deadlines, research sprints, or new faculty onboarding).
Engagement by Data Provider
Reports also break down usage by provider and by dataset, letting you see which datasets are resonating most with your campus community.
Each provider includes segmented metrics for:
- View activity
- Sample downloads
- Full consumption (i.e., full dataset delivery)
Example: People Data Labs might show the highest engagement, while niche providers may have smaller but highly targeted usage.
Updated 5 months ago